Increasing numbers of seniors, a higher proportion of widows, and an improved literacy rate are among the key highlights of the Census of Population and Housing 2024.
The Department of Census and Statistics released the final report of the Census of Population and Housing 2024 last week. The report provides comprehensive data on population distribution and growth, persons with difficulties, sex and age distribution, ethnic composition, as well as birth and mortality rates. It also includes detailed information on the working-age population and its distribution.
In addition, the report outlines trends related to non-communicable diseases, rising literacy rates, economically active populations, labour force participation, employment and unemployment, as well as fertility patterns.
Population Growth and Density
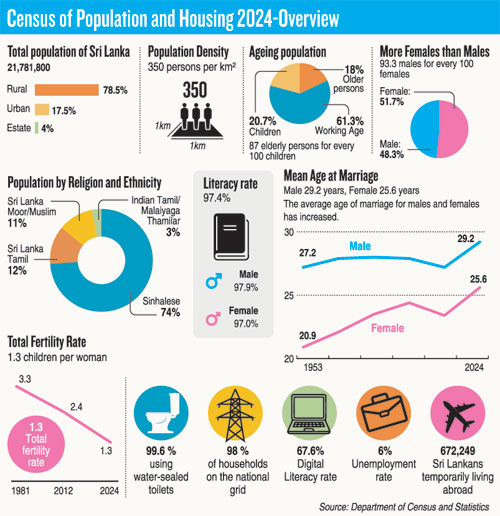
Population density per square kilometre has steadily increased over the decades. In 1981, the density was recorded at 230 persons per sq km. By 2001, it had risen to 300, and in 2012 it reached 325. In 2024, the population density further increased to 350 persons per square kilometre.
The Western Province accounts for 28.1% of the total population. Gampaha District recorded the highest population at 2.43 million, surpassing Colombo District, which stands at 2.37 million.
Nearly two-thirds of the population lives in four provinces: Western, Central, Southern, and North Western. Mullaitivu District remains the least populous, with 122,619 residents.
Sri Lanka’s population as of December 19, 2024, was 21.78m, an increase of 1.42m versus 2012.
Ageing Population and Demographic Structure
The 2024 census reflects a clear transition toward an ageing society. The elderly population now constitutes 18% of the total population, while the child population has declined to 20.7%. This translates to 87 elderly persons for every 100 children.
The median age of the population has risen to 35 years, an increase of at least five years compared to the 2012 census.
Gender Distribution and Marital Trends
The sex ratio indicates that females outnumber males, with females representing 51.7% of the population and males 48.3%.
According to the report, 41.8% of the population has never been married. The average age of marriage is 29 years for males and 25 years for females.
There is also a significant gender gap in widowhood among older adults. Among those aged over 65 years, 44.2% of females are widowed compared to 10.5% of males.
Fertility Trends
The total fertility rate has declined further to 1.3 in 2024. In comparison, the fertility rate was 3.3 in 1981 and dropped to 2.4 by 2012.
Fertility rates vary across sectors. Women in the estate sector recorded a higher fertility rate of 1.6 compared to urban and rural areas. Among ethnic groups, Muslim women recorded the highest fertility rate at 2, while Sinhala women recorded the lowest at 1.2.
Ethnic Composition
The census identifies Sinhalese as the largest ethnic group in Sri Lanka, numbering 16.14 million. This is followed by 2.68 million Sri Lankan Tamils and 2.28 million Sri Lankan Moors/Muslims.
Comparing 2012 and 2024 data, the Sinhalese population has declined from 74.9% to 74.1%. The Indian Tamil population has decreased from 4.1% to 2.8%. However, the Sri Lankan Muslim population has increased from 9.3% to 10.5%, while the Sri Lankan Tamil population has grown from 11.5% to 12.3%.
Literacy and Education
The national literacy rate has increased to 97.4% in 2024, up from 95.7% in 2012. The gender gap in literacy has almost closed, with male literacy at 97.9% and female literacy at 97.0%.
Disability and Health Conditions
According to the census, 3.2 million people (157 per 1,000 population) report at least one physical or mental difficulty.
Additionally, 727,293 individuals have been identified with disabilities related to vision, hearing, mobility, cognition, self-care, and communication, representing a national disability rate of 35%.
The report also states that 4.18 million people are living with non-communicable diseases. High blood pressure and diabetes are the most prevalent conditions, with higher rates observed among females and older individuals.
The census further notes that the risk of non-communicable diseases increases with higher levels of education, contributing to a health literacy gap.
Migration and Employment
Lifetime migrants account for 13% of the population. Migration is primarily driven by marriage, followed by employment.
The highest number of internal migrants is reported in Gampaha District, followed by Colombo District. In both districts, employment is the main reason for migration.
The labour force participation rate stands at 47.3%, while 52.7% of working-age individuals are economically inactive.
Among the inactive population, 50.6% are women engaged in domestic and caregiving responsibilities, while 41.3% of men are inactive due to education or professional training.
Housing, Sanitation, and Energy
The report highlights high sanitation standards, with 99.6% of households using water-sealed toilets.
The National Water Supply and Drainage Board serves as the main water source for 38.9% of households.
In terms of household energy use, 55.4% still rely on firewood for cooking, although there has been a significant shift toward Liquefied Petroleum Gas (LPG), which is now used by 42.4% of households.


